> ## Documentation Index
> Fetch the complete documentation index at: https://docs.opper.ai/llms.txt
> Use this file to discover all available pages before exploring further.
# Traces
> See the full tree behind every call — model calls, tool calls, and every rule that fired.
Tracing records what happened inside every call—the model call, any nested tool
or LLM calls, and any rules that ran. Each call becomes a **trace**: a tree of
**spans** you can open and inspect.
A typical use: figure out why one request was slow or wrong — which model ran, how long each step took, what a tool returned, and what a judge scored it.
By default, traces record **metadata only** — model, cost, and latency. To capture full inputs and outputs, turn on a [retention rule](/control-plane/rules/retention).
## What you see in the dashboard
Open **Traces** in [platform.opper.ai](https://platform.opper.ai). Three views build on each other.
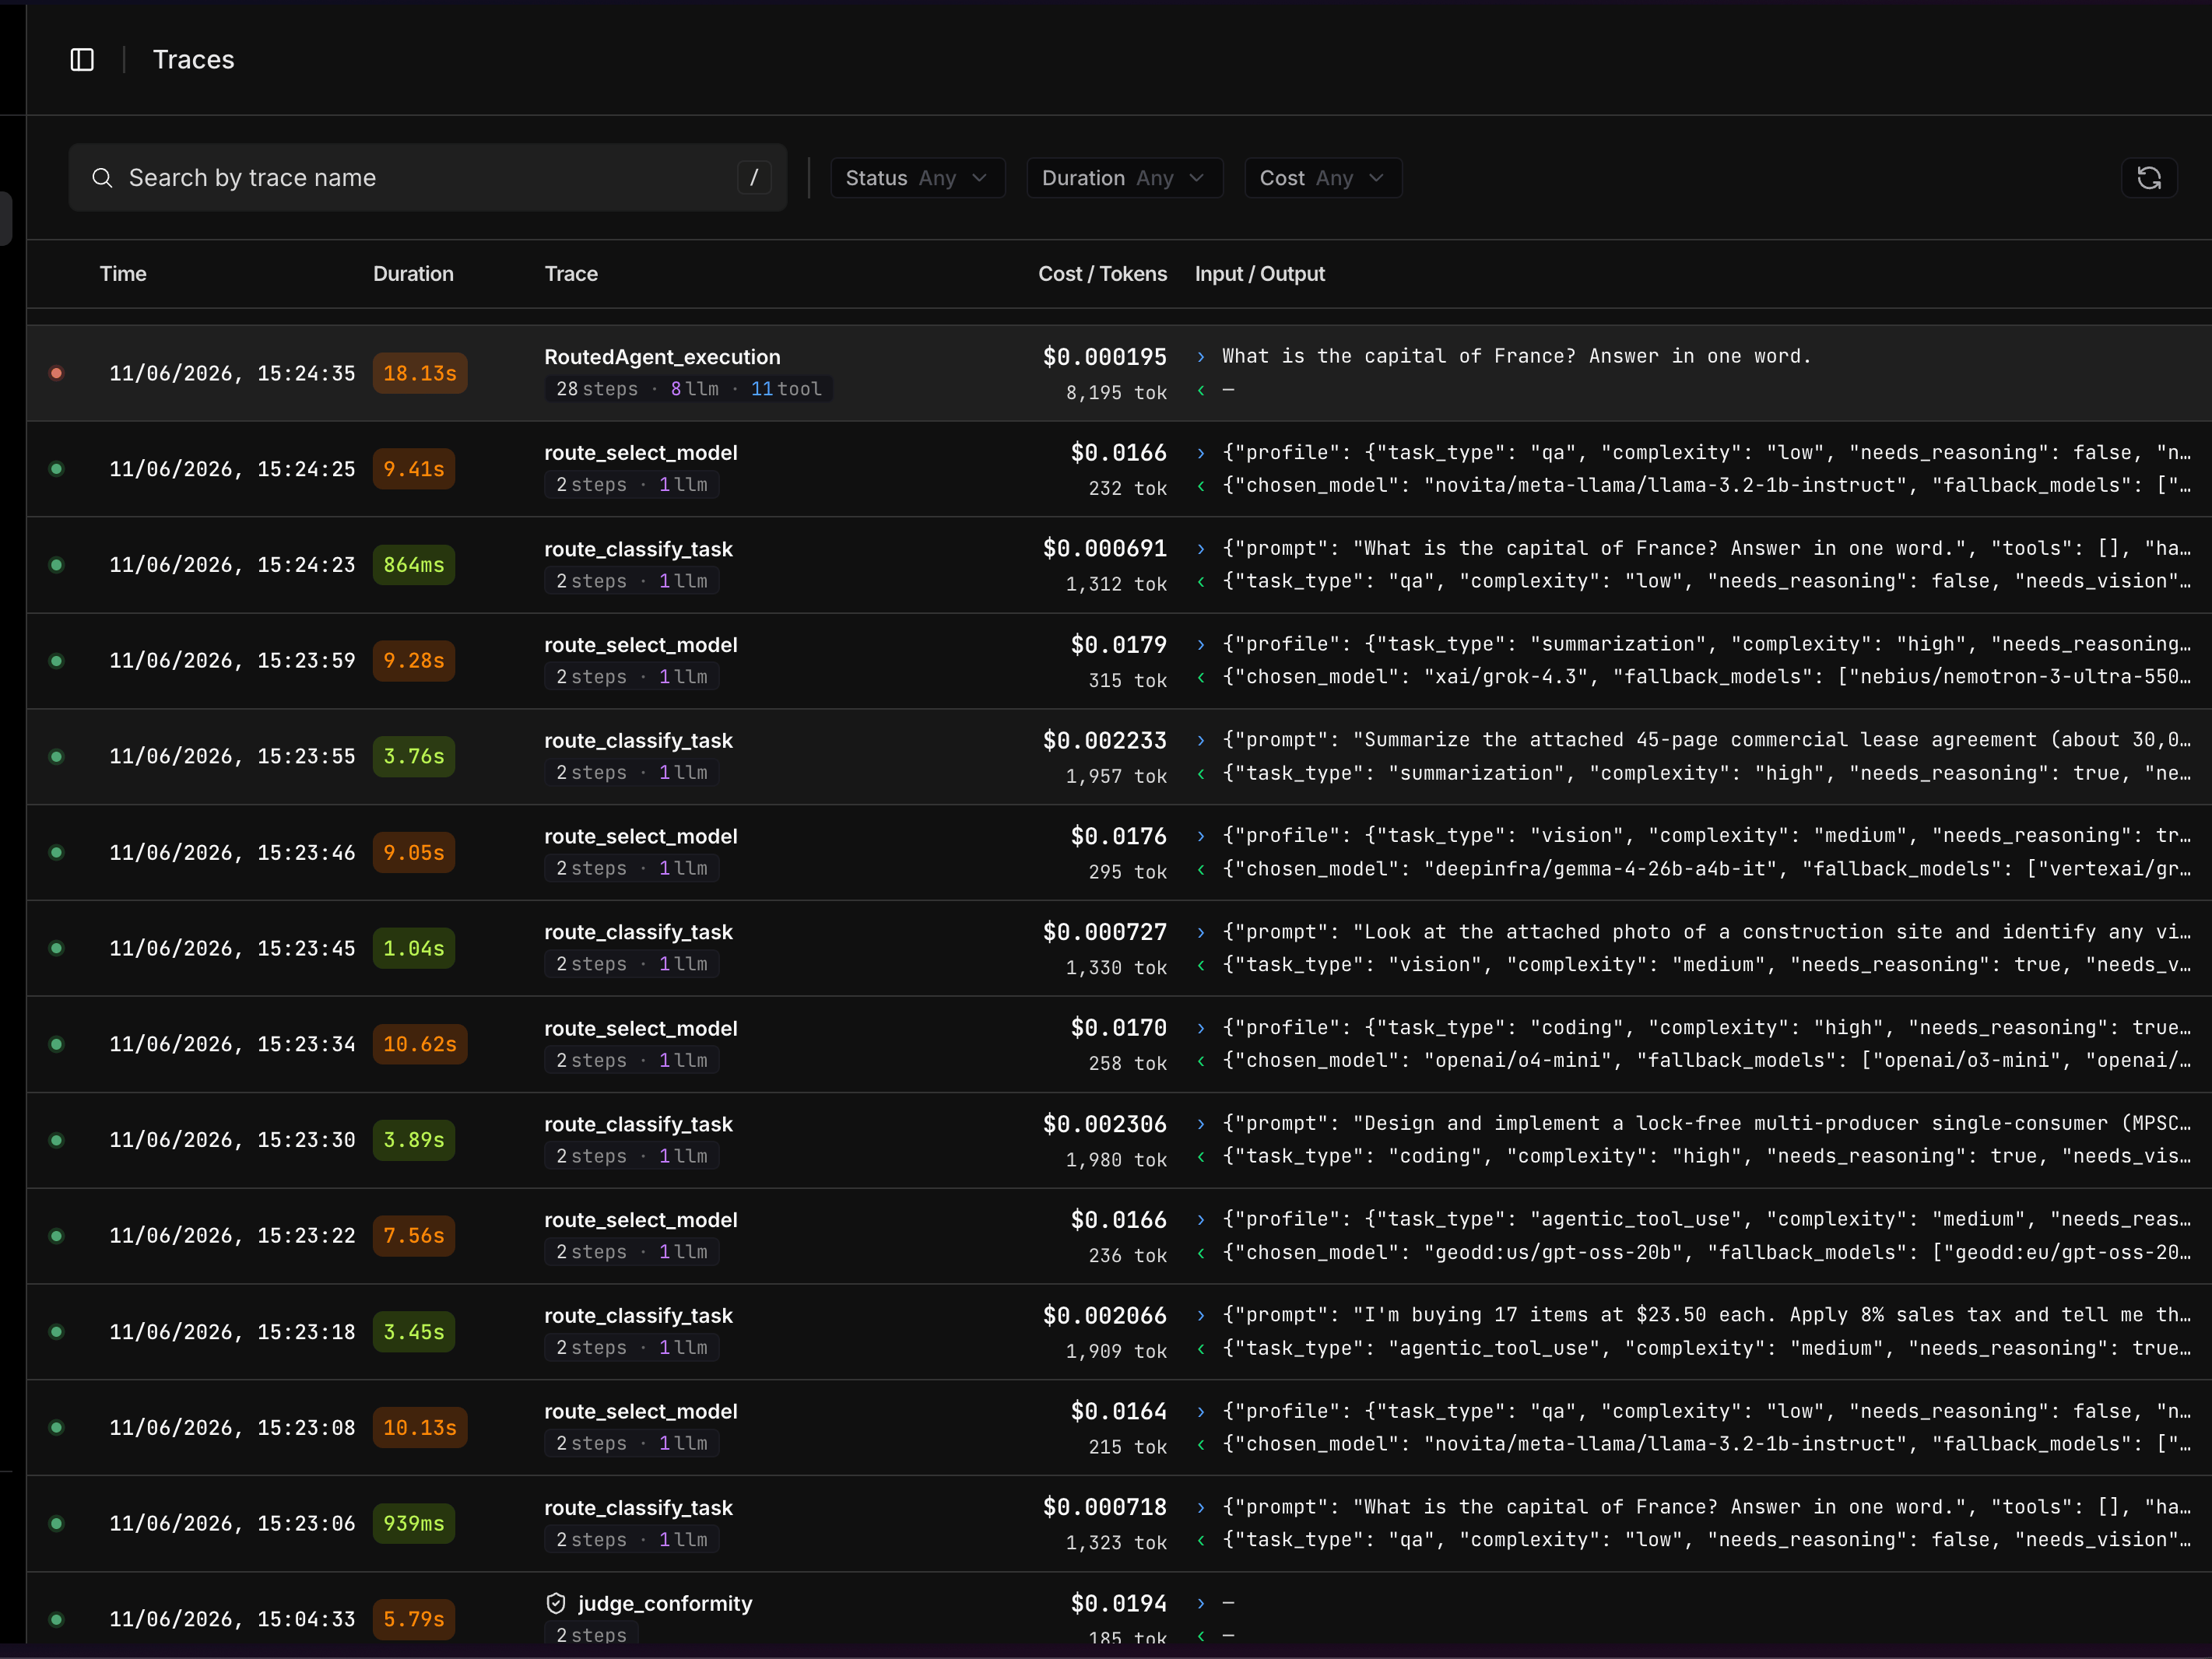
**The trace explorer** lists recent traces, each row showing the time, total duration, the trace name with its step composition (e.g. *28 steps · 8 llm · 11 tool*), cost and tokens, and a preview of the input and output. A status dot flags failures, and you can search by trace name or filter by **Status**, **Duration**, and **Cost**.
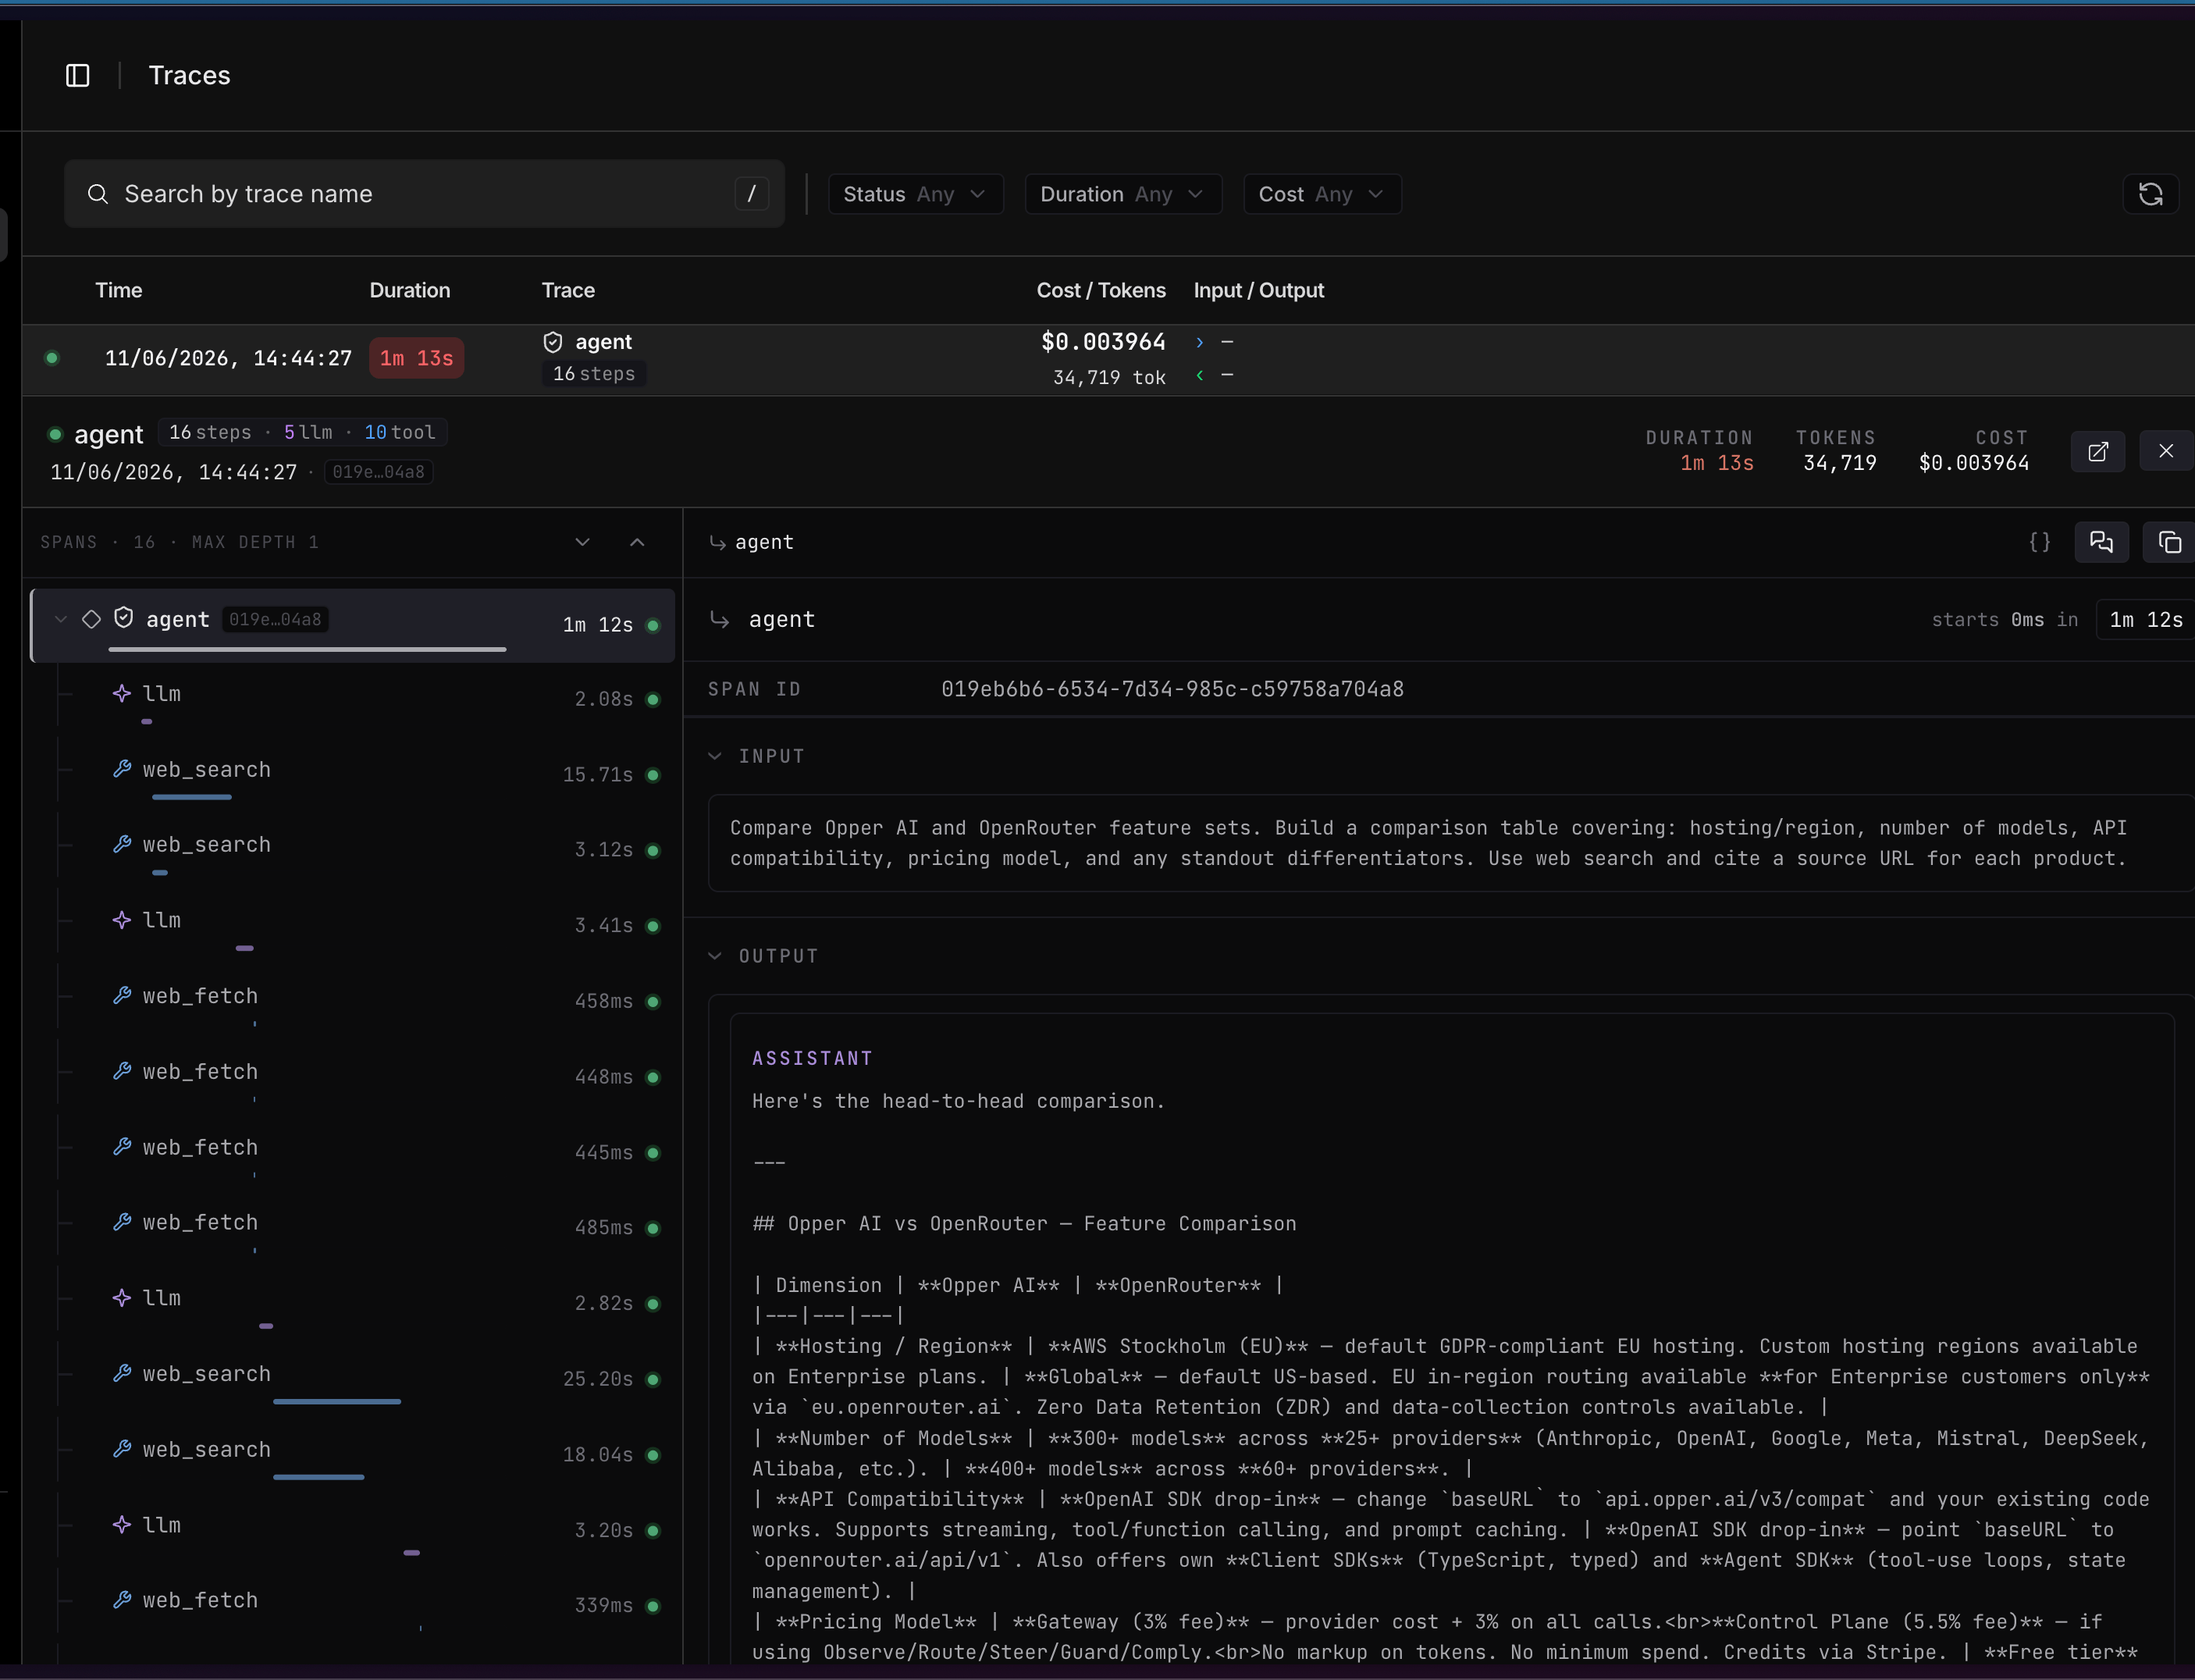
 **The span tree** opens when you click a trace. The left pane lists every span as a row with its name and duration, drawn as a timeline bar so you can see where time went and which calls fanned out from which. Generations (`llm`) and tool calls (`web_search`, `web_fetch`, …) nest under the step that ran them. The header sums up the whole trace — **duration**, **tokens**, and **cost**.
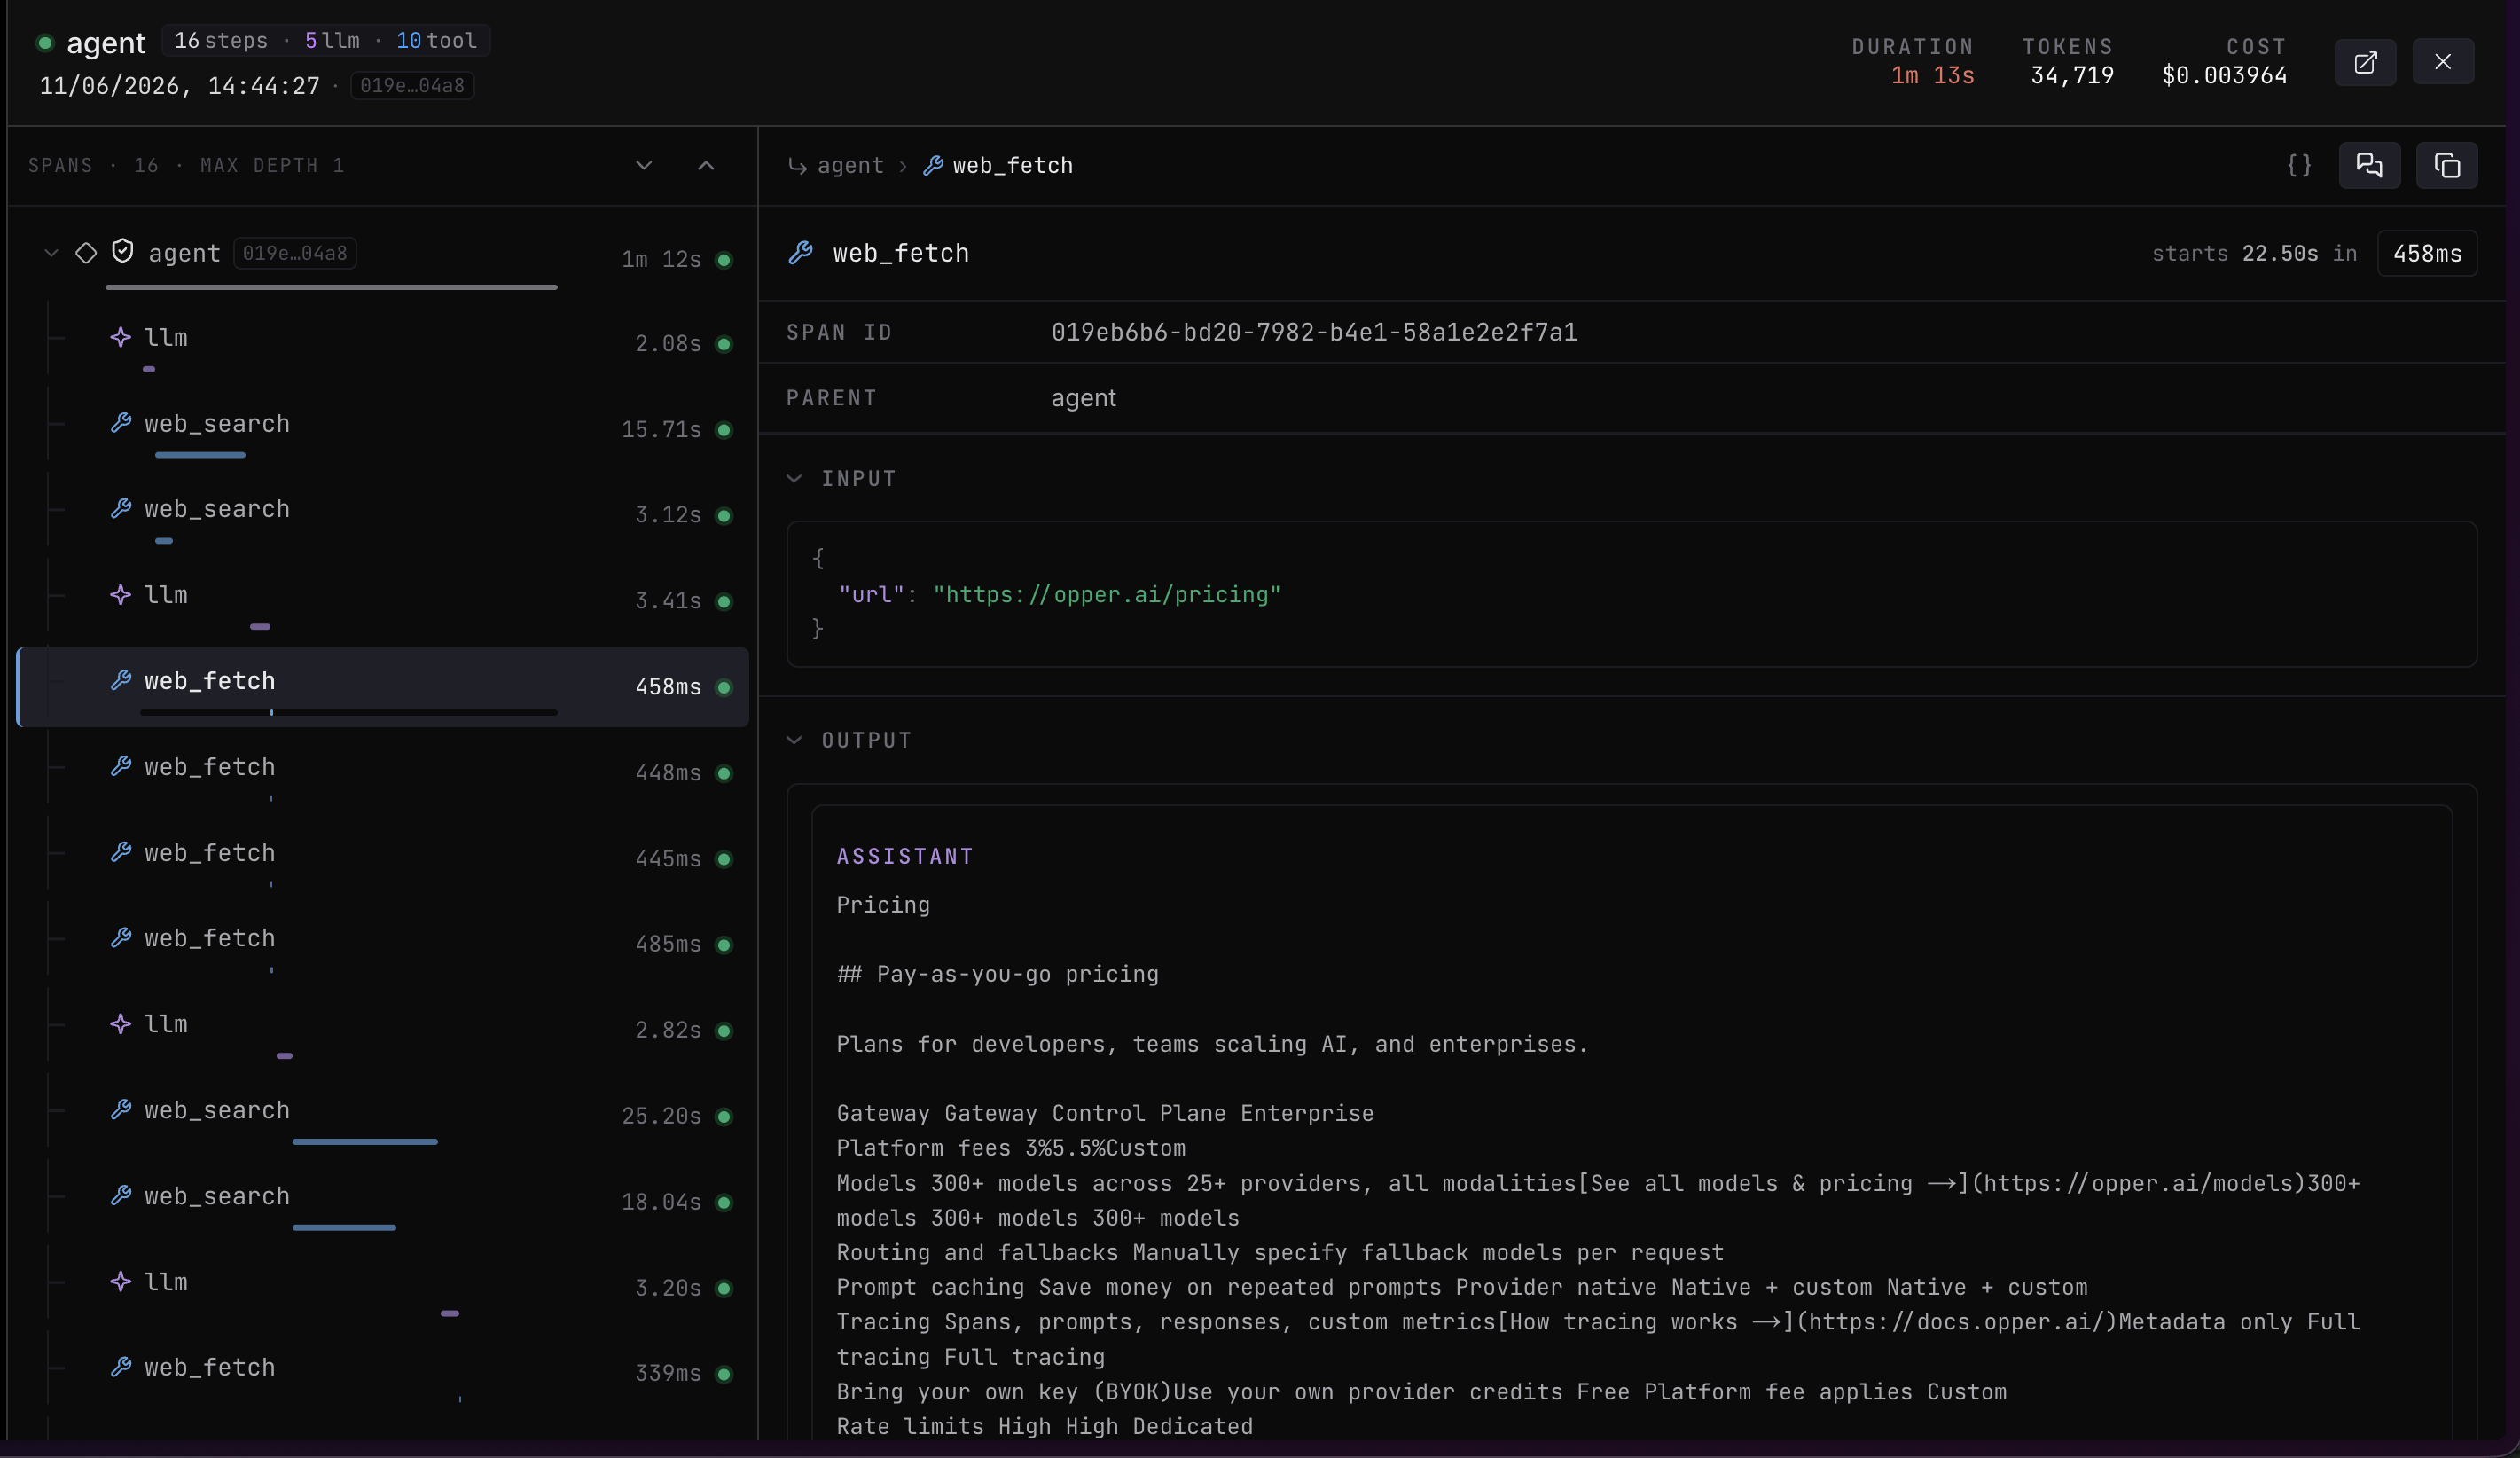
 **The span detail** pane shows everything for the selected span: its span ID, parent, where it starts within the trace, its duration, and — with retention on — the full input and output (rendered as chat, or as raw JSON with the `{}` toggle). Click into any span to drill down through the breadcrumb at the top.
 ### Quick actions
A few actions sit in the header of each view:
| Action | What it does |
| ------------------------- | --------------------------------------------------------------------------------------------------------------------------------------------- |
| **Open in playground** | Loads the trace into the [playground](https://platform.opper.ai) as an editable conversation so you can replay and iterate on it (see below). |
| **Copy span** | Copies the span's full JSON (input, output, metadata, timings) to your clipboard, handy for sharing a repro or pasting into an issue. |
| **Open trace in new tab** | Opens the full trace on its own page (via the ↗ icon), so you can keep it open while you work or share a direct link to it. |
### Replay a trace in the playground
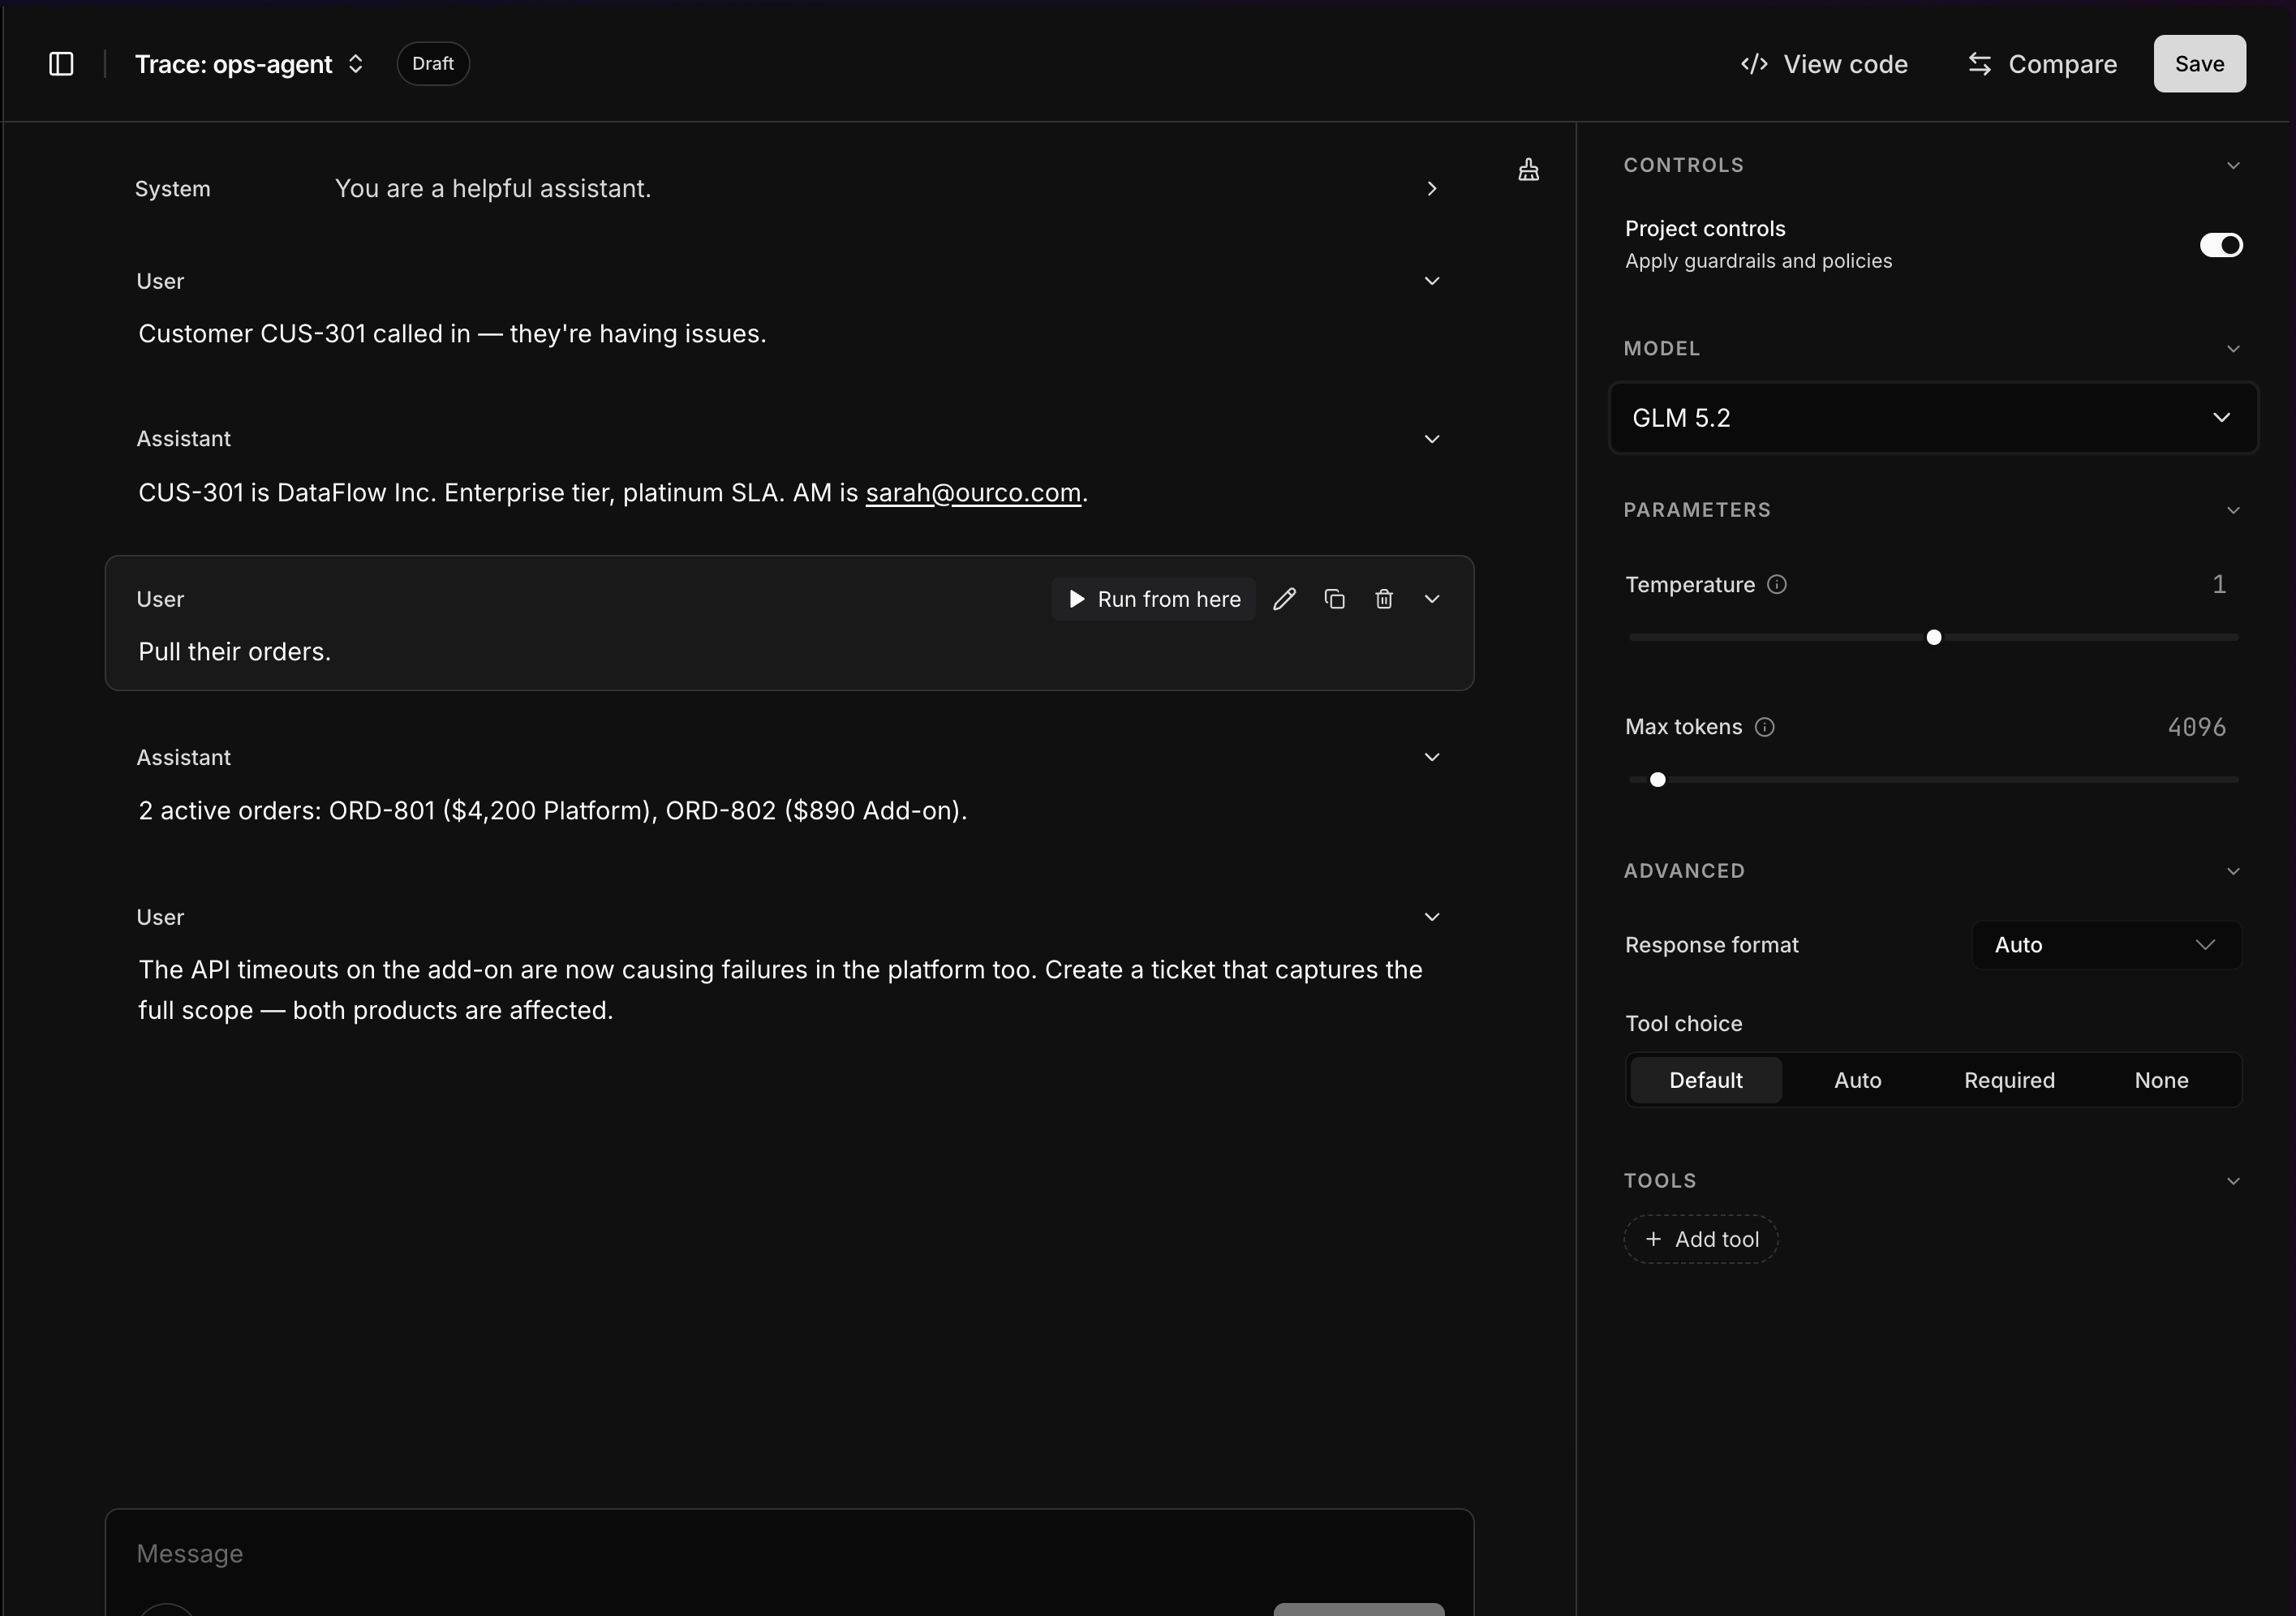
**Open in playground** reconstructs the trace as an editable conversation — every system, user, and assistant turn, in order — so you can pick up a real production run and iterate on it.
### Quick actions
A few actions sit in the header of each view:
| Action | What it does |
| ------------------------- | --------------------------------------------------------------------------------------------------------------------------------------------- |
| **Open in playground** | Loads the trace into the [playground](https://platform.opper.ai) as an editable conversation so you can replay and iterate on it (see below). |
| **Copy span** | Copies the span's full JSON (input, output, metadata, timings) to your clipboard, handy for sharing a repro or pasting into an issue. |
| **Open trace in new tab** | Opens the full trace on its own page (via the ↗ icon), so you can keep it open while you work or share a direct link to it. |
### Replay a trace in the playground
**Open in playground** reconstructs the trace as an editable conversation — every system, user, and assistant turn, in order — so you can pick up a real production run and iterate on it.
 From here you can:
* **Run from here** — hover any message and replay the conversation from that point, so you can change one turn and see how the run plays out without rerunning everything before it.
* **Switch the model** — pick a different model from the **Model** dropdown to see how another model handles the same input, and adjust **Parameters** (temperature, max tokens), **Controls**, and **Tools** alongside it.
* **View code**, **Compare**, or **Save** the result — none of this touches production, so it's a safe place to debug a bad trace or tune a prompt.
## The trace model
A trace is a tree of spans. The **root span** names the trace; every other span points to its parent through `parent_id`, which is how the tree is built. Spans of type `generation` are the LLM calls; tool and function calls appear as their own spans nested under the step that invoked them.
| Field | What it holds |
| ------------------------- | ------------------------------------------------------------------------------- |
| `name` | Human-readable label for the step. The root span's name becomes the trace name. |
| `type` | Span kind — e.g. `generation` (an LLM call), `function`, or `call`. |
| `input` / `output` | The data into and out of the step. Stored only with retention on. |
| `start_time` / `end_time` | UTC timestamps; the dashboard derives a duration from them. |
| `parent_id` | The parent span, used to build the tree. Empty on the root span. |
| `error` | Error message if the step failed. |
| `meta` / `tags` | Arbitrary metadata you attach for filtering and context. |
| `score` | Numeric score on the span. |
| `metrics` | Custom measurements, each a `dimension` + `value` (+ optional `comment`). |
Generation spans carry extra detail — the `model` that ran, `total_tokens`, the `instructions` used, and, when a [score check](/control-plane/rules/checks#score-checks) runs, the judge's `observations` and per-criterion `scorer_context`.
The trace itself rolls up its spans: `name`, `input`, `output`, `start_time`/`end_time`, `duration_ms`, `status`, `span_count`, and `total_tokens`, plus the ordered `spans` tree and any `events`.
## Retention
Retention rules attach at the org or project level, so you can set different policies for different projects — full retention on a staging project while you debug, metadata only on a sensitive production one, and so on. Set them in [Data retention](/control-plane/rules/retention).
See [Core concepts](/overview/concepts) for how this fits into the request path.
## Instrument custom spans
Most spans are created for you. To trace work that happens outside a single Gateway call — a multi-step pipeline, a background job, your own retrieval step — create spans yourself. A span with no `parent_id` starts a new trace; pass `parent_id` to nest a child under it.
```python Python theme={null}
from datetime import datetime, timezone
from opperai import Opper
opper = Opper()
# Root span — starts a new trace
span = opper.spans.create(
name="my-pipeline",
start_time=datetime.now(timezone.utc).isoformat(),
input="Starting the pipeline",
meta={"userId": "u-123"},
)
# Child span — nested under the root via parent_id
step = opper.spans.create(
name="retrieve-context",
parent_id=span.id,
start_time=datetime.now(timezone.utc).isoformat(),
)
# Close a span with its output and end time
opper.spans.update(
step.id,
output="Found 5 documents",
end_time=datetime.now(timezone.utc).isoformat(),
)
print(f"Span: {span.id}, Trace: {span.trace_id}")
```
```typescript TypeScript theme={null}
import { Opper } from "opperai";
const opper = new Opper();
// Root span — starts a new trace
const span = await opper.spans.create({
name: "my-pipeline",
start_time: new Date().toISOString(),
input: "Starting the pipeline",
meta: { userId: "u-123" },
});
// Child span — nested under the root via parent_id
const step = await opper.spans.create({
name: "retrieve-context",
parent_id: span.id,
start_time: new Date().toISOString(),
});
// Close a span with its output and end time
await opper.spans.update(step.id, {
output: "Found 5 documents",
end_time: new Date().toISOString(),
});
console.log(`Span: ${span.id}, Trace: ${span.trace_id}`);
```
```bash cURL theme={null}
# Root span — starts a new trace
curl -X POST https://api.opper.ai/v3/spans \
-H "Authorization: Bearer $OPPER_API_KEY" \
-H "Content-Type: application/json" \
-d '{
"name": "my-pipeline",
"start_time": "2026-06-17T10:00:00Z",
"input": "Starting the pipeline",
"meta": {"userId": "u-123"}
}'
# Child span — pass parent_id to nest it
curl -X POST https://api.opper.ai/v3/spans \
-H "Authorization: Bearer $OPPER_API_KEY" \
-H "Content-Type: application/json" \
-d '{
"name": "retrieve-context",
"parent_id": "SPAN_ID",
"start_time": "2026-06-17T10:00:01Z"
}'
# Close a span with its output and end time
curl -X PATCH https://api.opper.ai/v3/spans/SPAN_ID \
-H "Authorization: Bearer $OPPER_API_KEY" \
-H "Content-Type: application/json" \
-d '{
"output": "Found 5 documents",
"end_time": "2026-06-17T10:00:05Z"
}'
```
## Read traces programmatically
List recent traces, then fetch one to walk its span tree.
```python Python theme={null}
from opperai import Opper
opper = Opper()
traces = opper.traces.list(limit=5)
for t in traces.data:
print(f"{t.id} - {t.name or '(unnamed)'} ({t.span_count} spans)")
trace = opper.traces.get(traces.data[0].id)
for s in trace.spans:
indent = " " if not s.parent_id else " "
print(f"{indent}{s.name} ({s.id[:8]}...)")
```
```typescript TypeScript theme={null}
import { Opper } from "opperai";
const opper = new Opper();
const traces = await opper.traces.list({ limit: 5 });
for (const t of traces.data) {
console.log(`${t.id} - ${t.name ?? "(unnamed)"} (${t.span_count} spans)`);
}
const trace = await opper.traces.get(traces.data[0].id);
for (const s of trace.spans) {
const indent = s.parent_id ? " " : " ";
console.log(`${indent}${s.name} (${s.id.slice(0, 8)}...)`);
}
```
```bash cURL theme={null}
# List recent traces
curl https://api.opper.ai/v3/traces?limit=5 \
-H "Authorization: Bearer $OPPER_API_KEY"
# Get one trace with its full span tree
curl https://api.opper.ai/v3/traces/TRACE_ID \
-H "Authorization: Bearer $OPPER_API_KEY"
```
## Events and feedback on spans
As a call runs, Opper records rule and routing activity as **events** on the
relevant span. Each event has a `kind`—`guardrail`, `observe`, `route`, `comply`,
or `feedback`—plus a source and data payload. These backend event names remain
for API compatibility even though the platform now presents them through Rules.
You can also write your own events — for example, capturing thumbs-up/down feedback from your app — with `POST /v3/spans/{id}/events`, and read them back with `GET /v3/spans/{id}/events`.
Use `meta` and `tags` on your custom spans to record context like user, tenant, or feature flag. It makes traces far easier to filter and group later. To attribute usage and **cost** by those same dimensions, tag the calls themselves — see [Tags & usage attribution](/build/gateway/usage-attribution).
## Where to go next
Score every response against criteria you write. Results land on the trace.
Turn on retention so traces store full inputs and outputs.
Create, update, and read spans directly over the API.
How traces fit into the two-plane model and the request path.
From here you can:
* **Run from here** — hover any message and replay the conversation from that point, so you can change one turn and see how the run plays out without rerunning everything before it.
* **Switch the model** — pick a different model from the **Model** dropdown to see how another model handles the same input, and adjust **Parameters** (temperature, max tokens), **Controls**, and **Tools** alongside it.
* **View code**, **Compare**, or **Save** the result — none of this touches production, so it's a safe place to debug a bad trace or tune a prompt.
## The trace model
A trace is a tree of spans. The **root span** names the trace; every other span points to its parent through `parent_id`, which is how the tree is built. Spans of type `generation` are the LLM calls; tool and function calls appear as their own spans nested under the step that invoked them.
| Field | What it holds |
| ------------------------- | ------------------------------------------------------------------------------- |
| `name` | Human-readable label for the step. The root span's name becomes the trace name. |
| `type` | Span kind — e.g. `generation` (an LLM call), `function`, or `call`. |
| `input` / `output` | The data into and out of the step. Stored only with retention on. |
| `start_time` / `end_time` | UTC timestamps; the dashboard derives a duration from them. |
| `parent_id` | The parent span, used to build the tree. Empty on the root span. |
| `error` | Error message if the step failed. |
| `meta` / `tags` | Arbitrary metadata you attach for filtering and context. |
| `score` | Numeric score on the span. |
| `metrics` | Custom measurements, each a `dimension` + `value` (+ optional `comment`). |
Generation spans carry extra detail — the `model` that ran, `total_tokens`, the `instructions` used, and, when a [score check](/control-plane/rules/checks#score-checks) runs, the judge's `observations` and per-criterion `scorer_context`.
The trace itself rolls up its spans: `name`, `input`, `output`, `start_time`/`end_time`, `duration_ms`, `status`, `span_count`, and `total_tokens`, plus the ordered `spans` tree and any `events`.
## Retention
Retention rules attach at the org or project level, so you can set different policies for different projects — full retention on a staging project while you debug, metadata only on a sensitive production one, and so on. Set them in [Data retention](/control-plane/rules/retention).
See [Core concepts](/overview/concepts) for how this fits into the request path.
## Instrument custom spans
Most spans are created for you. To trace work that happens outside a single Gateway call — a multi-step pipeline, a background job, your own retrieval step — create spans yourself. A span with no `parent_id` starts a new trace; pass `parent_id` to nest a child under it.
```python Python theme={null}
from datetime import datetime, timezone
from opperai import Opper
opper = Opper()
# Root span — starts a new trace
span = opper.spans.create(
name="my-pipeline",
start_time=datetime.now(timezone.utc).isoformat(),
input="Starting the pipeline",
meta={"userId": "u-123"},
)
# Child span — nested under the root via parent_id
step = opper.spans.create(
name="retrieve-context",
parent_id=span.id,
start_time=datetime.now(timezone.utc).isoformat(),
)
# Close a span with its output and end time
opper.spans.update(
step.id,
output="Found 5 documents",
end_time=datetime.now(timezone.utc).isoformat(),
)
print(f"Span: {span.id}, Trace: {span.trace_id}")
```
```typescript TypeScript theme={null}
import { Opper } from "opperai";
const opper = new Opper();
// Root span — starts a new trace
const span = await opper.spans.create({
name: "my-pipeline",
start_time: new Date().toISOString(),
input: "Starting the pipeline",
meta: { userId: "u-123" },
});
// Child span — nested under the root via parent_id
const step = await opper.spans.create({
name: "retrieve-context",
parent_id: span.id,
start_time: new Date().toISOString(),
});
// Close a span with its output and end time
await opper.spans.update(step.id, {
output: "Found 5 documents",
end_time: new Date().toISOString(),
});
console.log(`Span: ${span.id}, Trace: ${span.trace_id}`);
```
```bash cURL theme={null}
# Root span — starts a new trace
curl -X POST https://api.opper.ai/v3/spans \
-H "Authorization: Bearer $OPPER_API_KEY" \
-H "Content-Type: application/json" \
-d '{
"name": "my-pipeline",
"start_time": "2026-06-17T10:00:00Z",
"input": "Starting the pipeline",
"meta": {"userId": "u-123"}
}'
# Child span — pass parent_id to nest it
curl -X POST https://api.opper.ai/v3/spans \
-H "Authorization: Bearer $OPPER_API_KEY" \
-H "Content-Type: application/json" \
-d '{
"name": "retrieve-context",
"parent_id": "SPAN_ID",
"start_time": "2026-06-17T10:00:01Z"
}'
# Close a span with its output and end time
curl -X PATCH https://api.opper.ai/v3/spans/SPAN_ID \
-H "Authorization: Bearer $OPPER_API_KEY" \
-H "Content-Type: application/json" \
-d '{
"output": "Found 5 documents",
"end_time": "2026-06-17T10:00:05Z"
}'
```
## Read traces programmatically
List recent traces, then fetch one to walk its span tree.
```python Python theme={null}
from opperai import Opper
opper = Opper()
traces = opper.traces.list(limit=5)
for t in traces.data:
print(f"{t.id} - {t.name or '(unnamed)'} ({t.span_count} spans)")
trace = opper.traces.get(traces.data[0].id)
for s in trace.spans:
indent = " " if not s.parent_id else " "
print(f"{indent}{s.name} ({s.id[:8]}...)")
```
```typescript TypeScript theme={null}
import { Opper } from "opperai";
const opper = new Opper();
const traces = await opper.traces.list({ limit: 5 });
for (const t of traces.data) {
console.log(`${t.id} - ${t.name ?? "(unnamed)"} (${t.span_count} spans)`);
}
const trace = await opper.traces.get(traces.data[0].id);
for (const s of trace.spans) {
const indent = s.parent_id ? " " : " ";
console.log(`${indent}${s.name} (${s.id.slice(0, 8)}...)`);
}
```
```bash cURL theme={null}
# List recent traces
curl https://api.opper.ai/v3/traces?limit=5 \
-H "Authorization: Bearer $OPPER_API_KEY"
# Get one trace with its full span tree
curl https://api.opper.ai/v3/traces/TRACE_ID \
-H "Authorization: Bearer $OPPER_API_KEY"
```
## Events and feedback on spans
As a call runs, Opper records rule and routing activity as **events** on the
relevant span. Each event has a `kind`—`guardrail`, `observe`, `route`, `comply`,
or `feedback`—plus a source and data payload. These backend event names remain
for API compatibility even though the platform now presents them through Rules.
You can also write your own events — for example, capturing thumbs-up/down feedback from your app — with `POST /v3/spans/{id}/events`, and read them back with `GET /v3/spans/{id}/events`.
Use `meta` and `tags` on your custom spans to record context like user, tenant, or feature flag. It makes traces far easier to filter and group later. To attribute usage and **cost** by those same dimensions, tag the calls themselves — see [Tags & usage attribution](/build/gateway/usage-attribution).
## Where to go next
Score every response against criteria you write. Results land on the trace.
Turn on retention so traces store full inputs and outputs.
Create, update, and read spans directly over the API.
How traces fit into the two-plane model and the request path.